

In this video I describe traits and techniques associated with coping with stressors. Susanne Kobasa identified commitment, challenge, and control as important factors in understanding hardiness and people who were able to thrive in stressful circumstances. Resilience in the face … Read More
Post-Traumatic Stress Disorder – PTSD

In this video I briefly describe the symptoms of post-traumatic stress disorder, the people most often affected by it, and research on potential risk factors for the development of PTSD, including hippocampal volume. Gilbertson et al (2002) – Smaller hippocampal … Read More
Control, Choice, Blame, & Stress

In this video I discuss the downsides of perceived control and choice and how we assign blame when things don’t go our way. I describe Sherman James’s idea of John Henryism, review the concept of locus of control, and consider … Read More
Skewness – Floor & Ceiling Effects
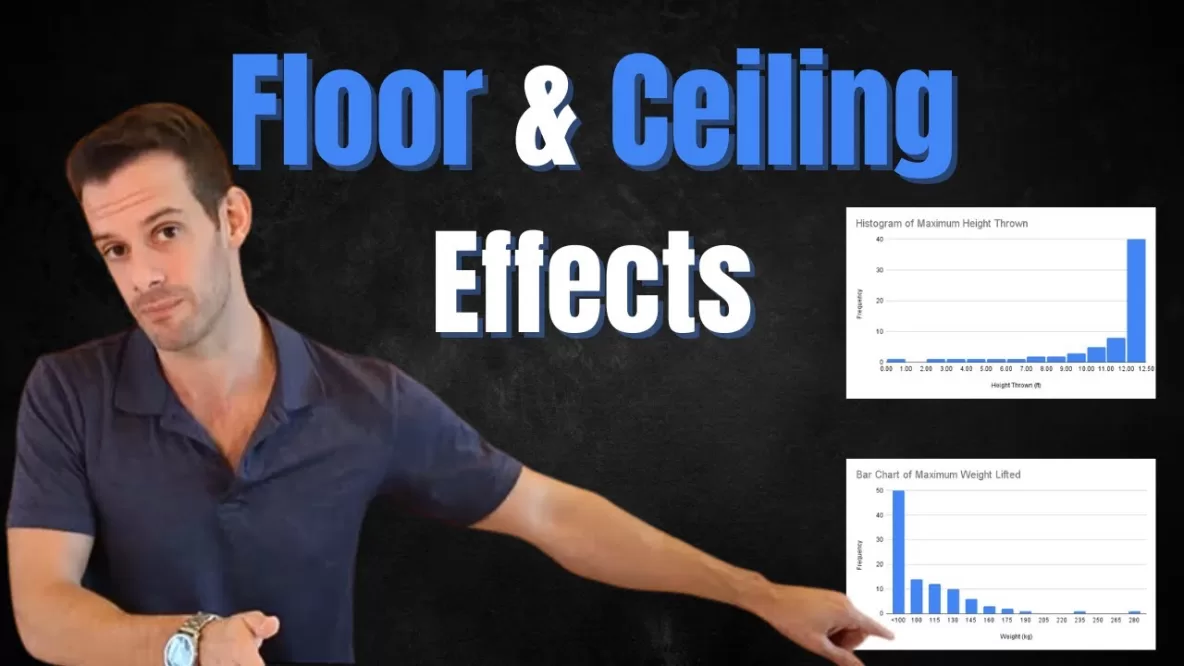
In this video I explain how skewness in a sample may be caused by a floor or a ceiling effect, in which the measurement isn’t able to capture variability at the low or high end of a population’s distribution. A … Read More
Skewness – Positive & Negative Skew
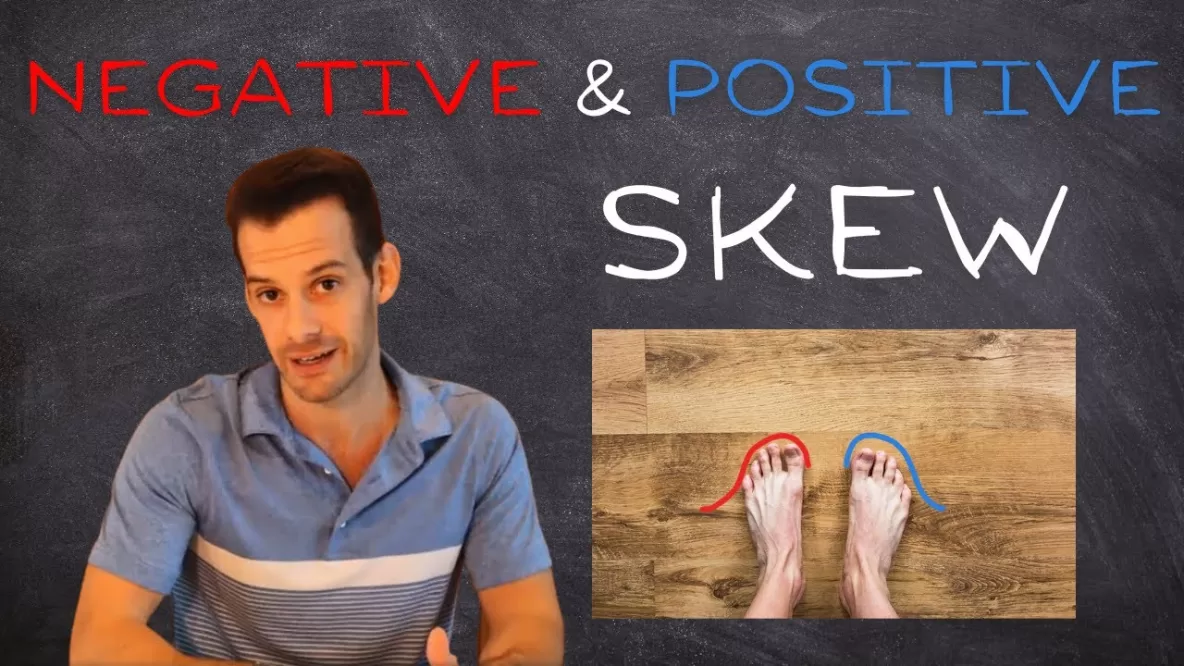
In this video I explain one way in which a distribution can deviate from normality, which is skewness. I explain the difference between positive and negative skew, and how these can be seen in histograms, stem and leaf displays, and … Read More
Exploratory Data Analysis: Box & Whisker Plots
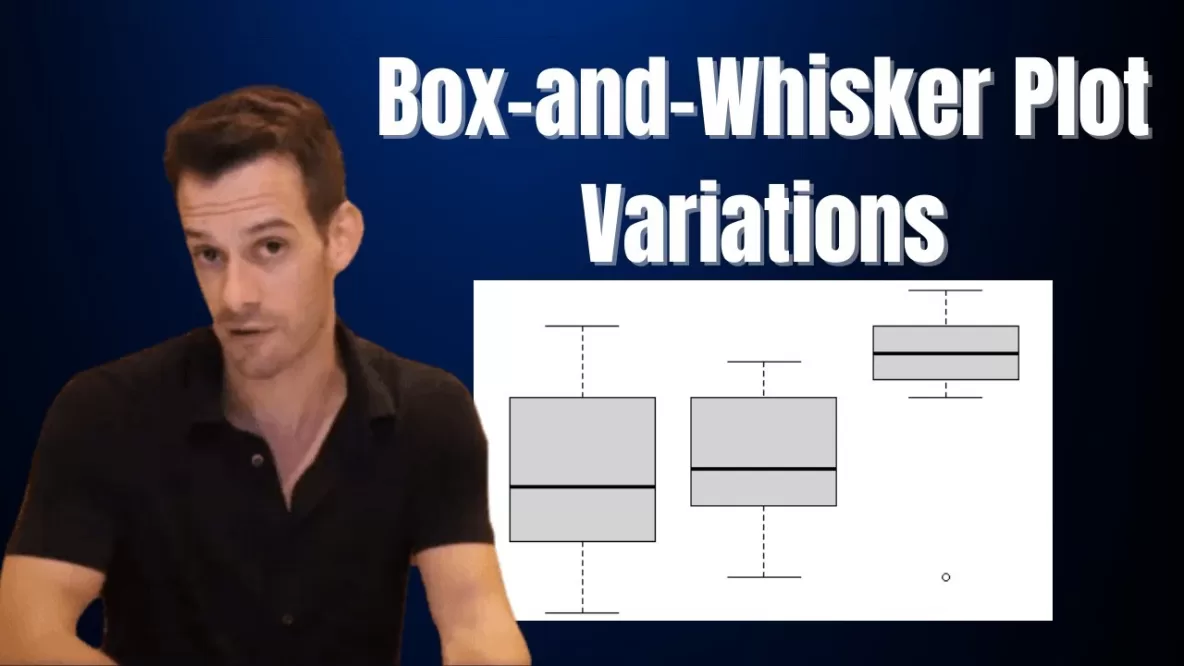
In this video I describe box-and-whisker plots, or boxplots, developed by John Tukey. First we’ll look at a simple box-and-whisker plot, then we’ll see some variations depending on the data, some different sets of terminology that can be used when … Read More
Exploratory Data Analysis: Stem & Leaf Displays
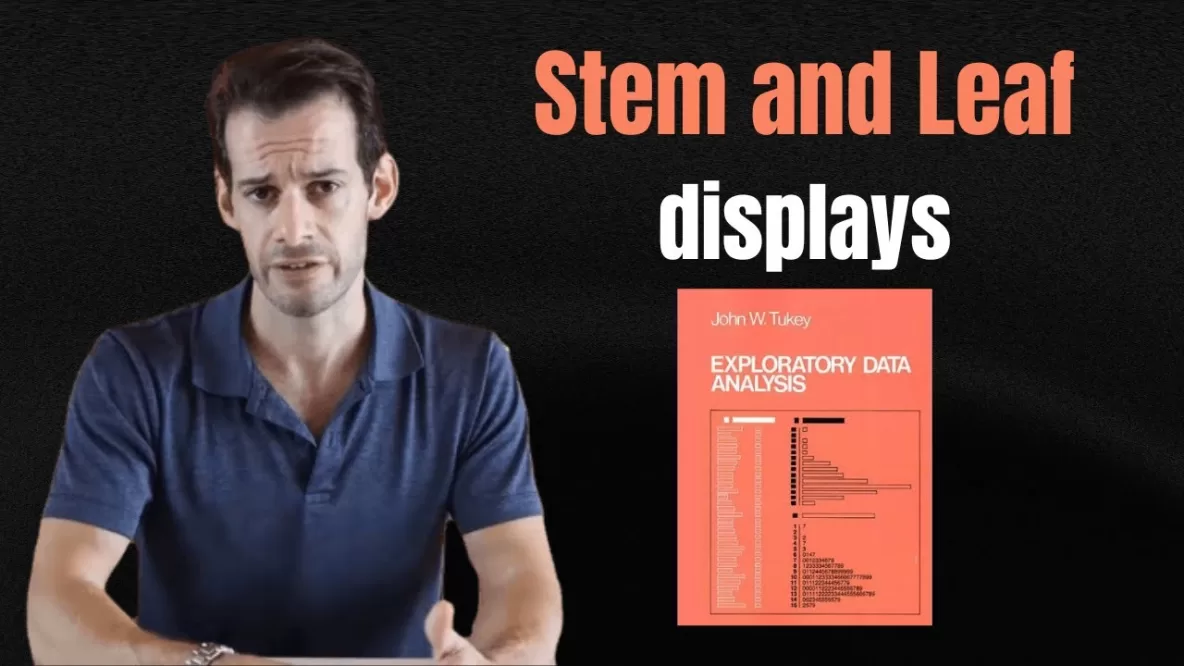
In this video I explain stem-and-leaf displays or stemplots, which are part of exploratory data analysis developed by John W. Tukey. I explain the basic design of stem-and-leaf displays as well as several variations including back-to-back stem-and-leaf displays and stretched … Read More
How to Interpret (and Create) Frequency Distribution Tables
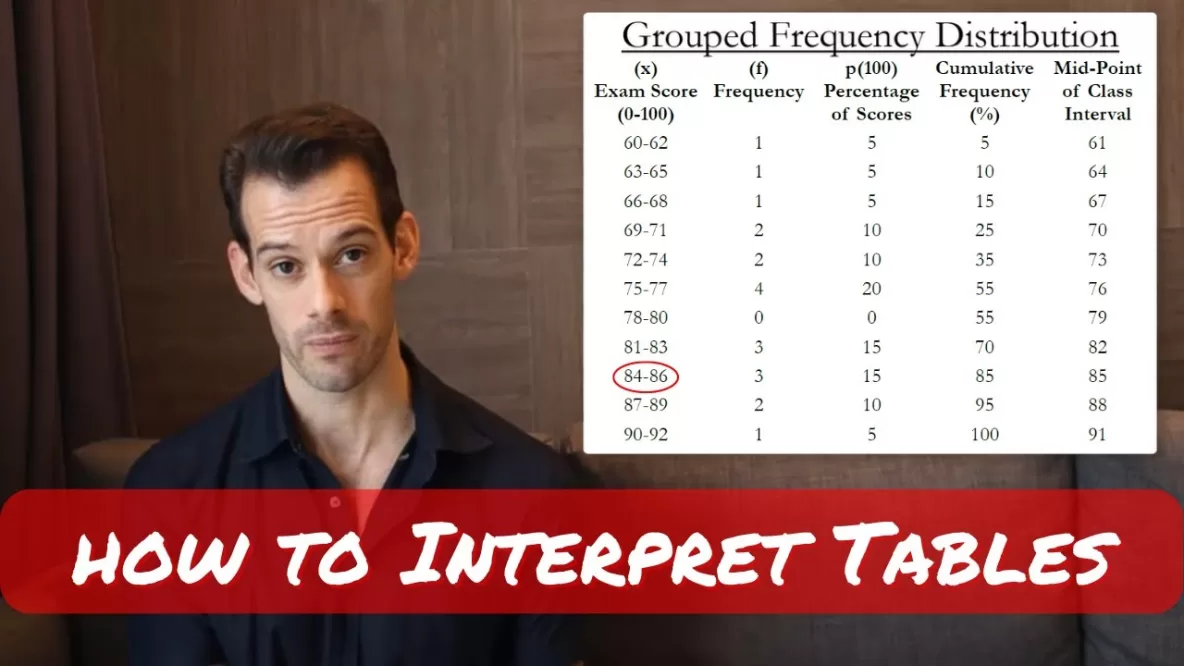
In this video I explain frequency distribution tables and grouped frequency distribution tables for summarizing data. I explain each of the columns, including the variable measured, the frequency, the proportion and percentage of the data at each variable, and the … Read More
n-1 Explained Conceptually
In this video I answer the common question of why we divide by n-1 when calculating variance from a sample, known as Bessel’s Correction. I focus on conceptual understanding of why this adjustment is needed and why n-1 is the … Read More
Mean Absolute Deviation, Variance, & Standard Deviation
In this video I explain how to use mean deviation, mean absolute deviation, variance, and standard deviation to assess dispersion in interval or ratio level data. I discuss each concept and practice calculating with a sample set of data, and … Read More